Using datasets from the Australian Bureau of Statistics (ABS) and Jobs and Skills Australia (JSA), the Regional Australia Institute (RAI) provides a monthly snapshot of the regional labour market, offering insights into key indicators for job vacancies, labour force size, participation rate, employed population and unemployment rate. This analysis not only captures current labour market dynamics but also examines historical trends to provide a comprehensive perspective for regional Australia.
Regional Australia is defined as all parts of Australia outside the five metropolitan cities with populations exceeding one million people-Sydney, Melbourne, Brisbane, Adelaide and Perth.
The December 2025 labour market data shows an expected seasonal softening in regional jobs vacancies but continuing tightness and strength in regional labour markets overall. Improvements in employment, participation, and unemployment indicate that labour demand remains broadly balanced by supply. Widespread lower regional job vacancies than this time last year, however, may point to a softening in regional labour markets in 2026.
Regional Job Vacancies
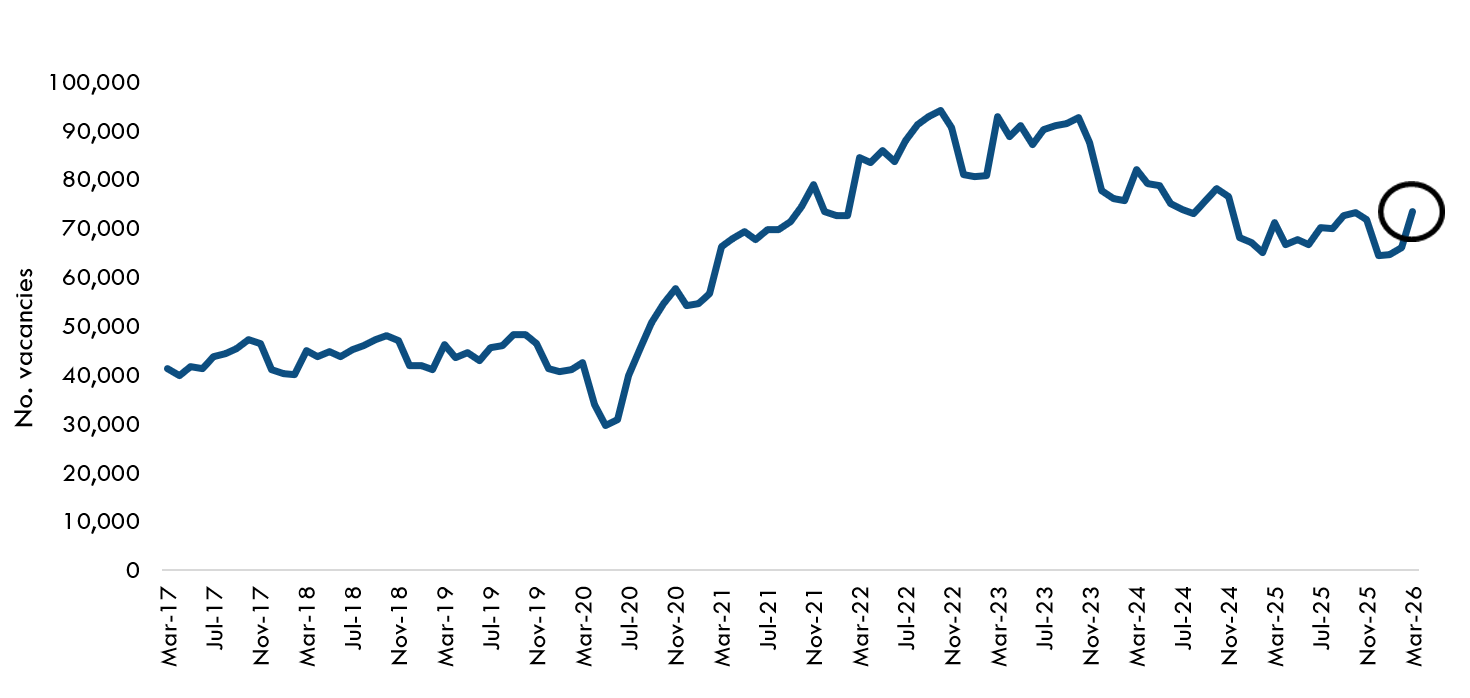
Regional job vacancies advertised online reached 73,414 in March 2026, recording an 11.3% increase from February following the usual post-Christmas decline. This represents a significant jump and the highest monthly vacancies since December 2024. Job vacancies were also higher than the same period last year, increasing by 3.1%. By comparison, metropolitan areas recorded a stronger monthly rise of 14.2%, but continued to decline over the year with vacancies down 1.0% annually.
Regional Australia Job Vacancies
Source: Jobs and Skills Australia, monthly internet vacancies, RAI
All states and territories recorded strong monthly growth in regional job vacancies. All states also recorded annual growth, however there were annual declines in the ACT and Northern Territory.
| Number
of job vacancies advertised online |
Feb-25 |
Jan-26 |
Feb-26 |
% change (monthly) |
% change (annual) |
| Regional Australia |
71,209 |
65,973 |
73,414 |
11.30% |
3.10% |
| Regional NSW |
19,403 |
18,900 |
21,389 |
13.20% |
10.20% |
| Regional VIC |
9,673 |
8,996 |
9,783 |
8.80% |
1.10% |
| Regional QLD |
23,008 |
21,424 |
23,658 |
10.40% |
2.80% |
| Regional SA |
1,941 |
1,943 |
2,164 |
11.40% |
11.50% |
| TAS |
3,291 |
3,049 |
3,359 |
10.20% |
2.10% |
| Regional WA |
5,328 |
4,857 |
5,374 |
10.60% |
0.90% |
| NT |
3,194 |
2,609 |
2,972 |
13.90% |
-6.90% |
| ACT |
5,372 |
4,195 |
4,714 |
12.40% |
-12.20% |
| Mainland Capital Cities |
144,255 |
125,051 |
142,854 |
14.20% |
-1.00% |
The individual regions with the highest monthly increases in jobs vacancies were:
- Tamworth and North West NSW (22.1%)
- Blue Mountains, Bathurst & Central West NSW (14.4%)
- Darwin (14.2%)
The top three occupational categories for regional job vacancies were Professionals (28%), Technicians and Trade Workers (16%) and Clerical and Administrative Workers (13%). At a more detailed level, the top three most in-demand regional occupations were: Medical Practitioners and Nurses (6,565), Carers and Aides (5,159) and General-Inquiry Clerks, Call Centre Workers, and Receptionists (5,143).
Regional Labour Force
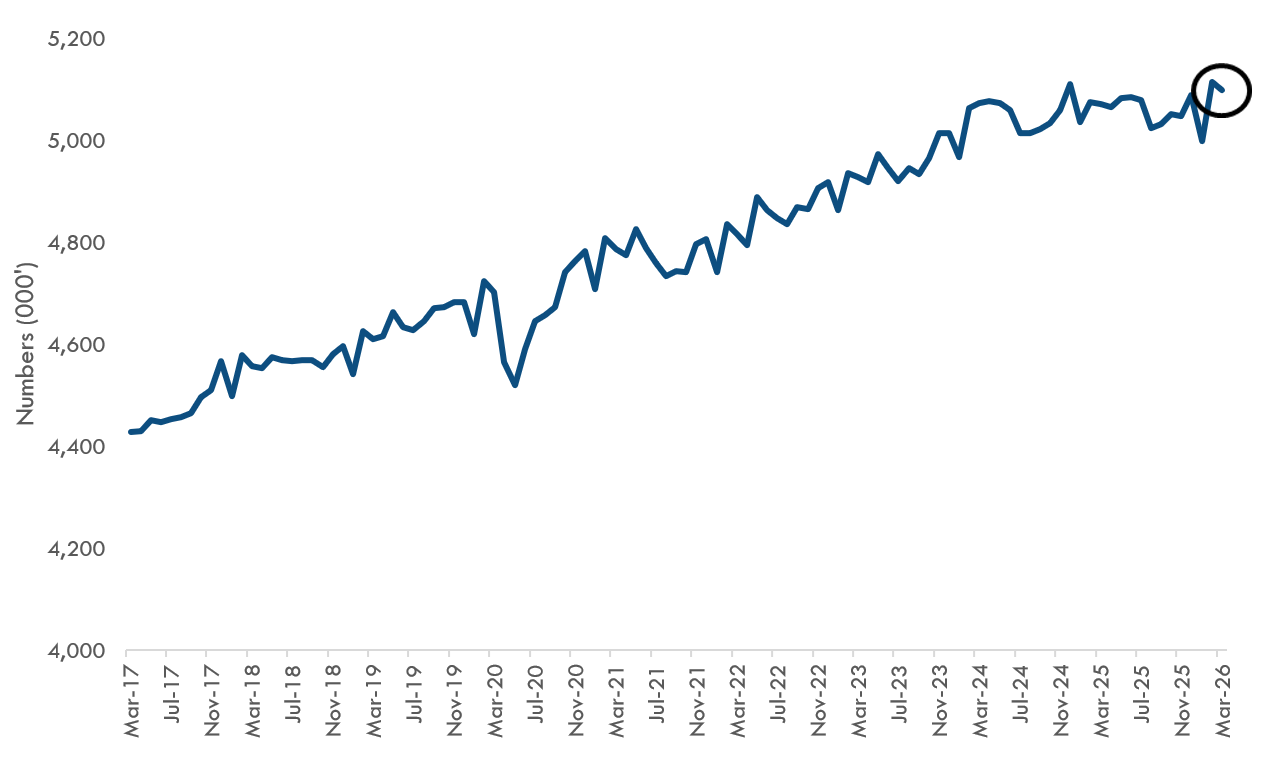
In March, the regional labour force remained broadly unchanged at 5,098,000, recording only a slight decline of 0.3% compared with the previous month. Despite short-term fluctuations, the long-term upward trend has been maintained, in line with regional population growth. This also represents a positive sign that more people are active in the labour market over time.
Regional Australia labour force size
Source: ABS Labour Force (detailed), RAI
The table below presents the regional labour force size by state and territory. New South Wales has the largest regional labour force with 1,505,600 people, but of the five mainland states Queensland has the largest regional labour force by share, making up 47.4% of the state’s total labour force. Western Australia has proportionally the smallest regional labour force at 17.8%. For Tasmania, the Northern Territory and the Australian Capital Territory, the entire jurisdiction is classified as regional Australia.
| State/Territory |
Regional Labour Force Size ('000) |
Percentage of total labour force (%) |
| NSW |
1,505.60 |
31.4 |
| Vic |
829.3 |
20.8 |
| Qld |
1,498.00 |
47.4 |
| SA |
208.3 |
20 |
| WA |
314.8 |
17.8 |
| Tas |
295.4 |
100 |
| NT |
153.2 |
100 |
| ACT |
293.2 |
100 |
| Australia |
5,097.70 |
32.9 |
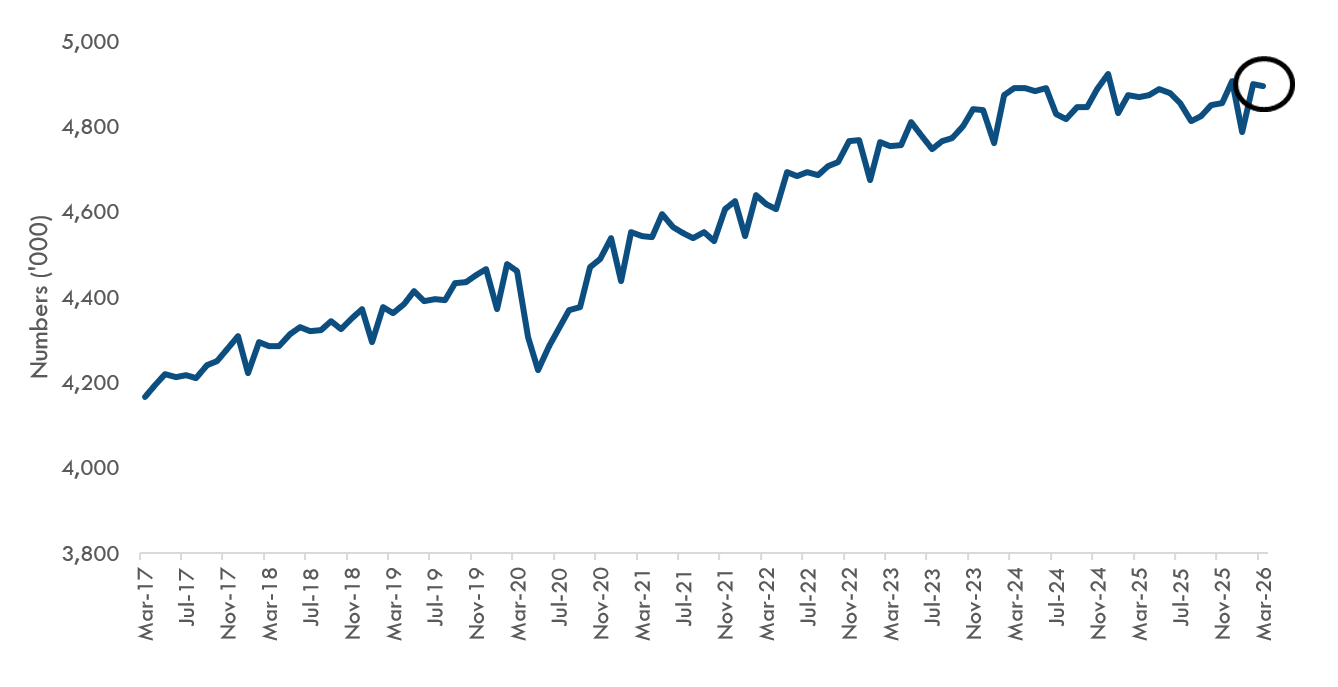
Regional Employed Persons
Consistent with the slight decline in the labour force, the number of employed people in regional Australia edged down to 4,896,000 in March, a marginal decline of 0.06% from the previous month.
Regional Australia employed people
Source: ABS Labour Force (detailed), RAI
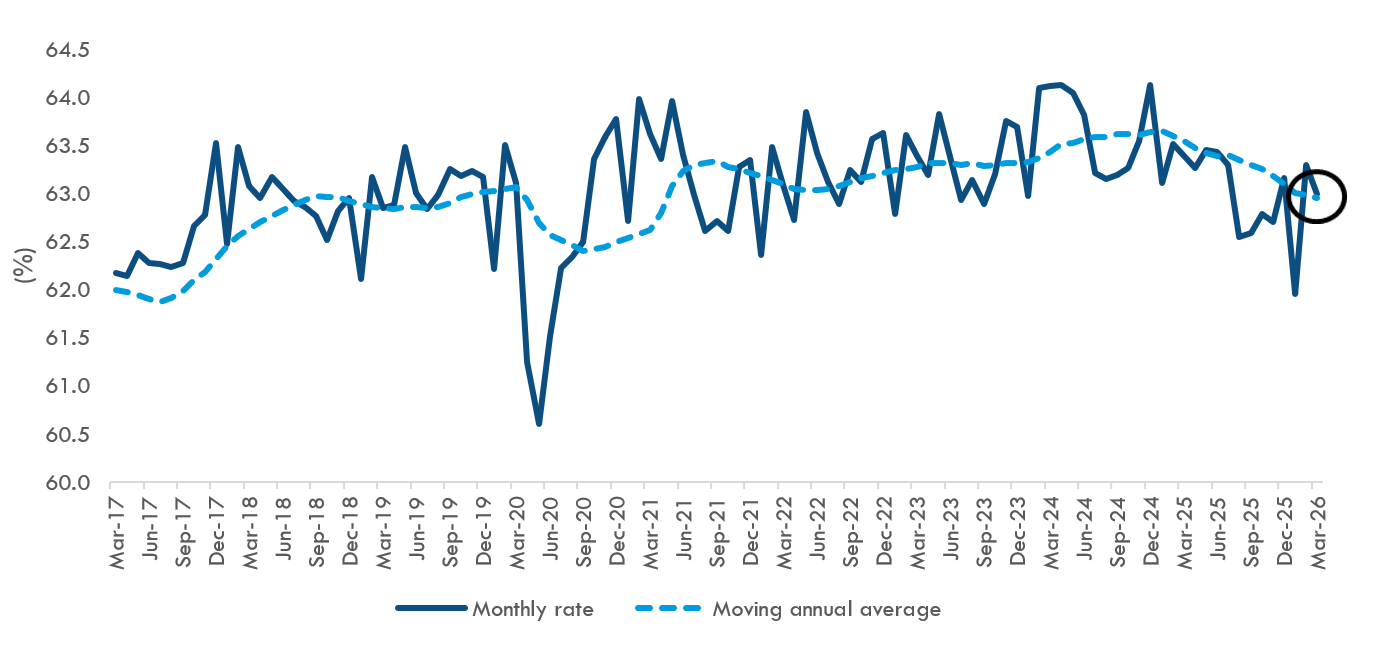
Regional Australia Participation Rate
The regional labour force participation rate stood at 63.0% in March 2026, a slight decrease from 63.3% in February. After smoothing out seasonal fluctuations, the annual moving average of the participation rate remains at 63.0% and has been trending downward since January 2025. Labour force participation measures the labour force as a percentage of all working-age people (aged 15 and over).
Regional Australia Participation Rate
Source: ABS Labour Force (detailed) RAI
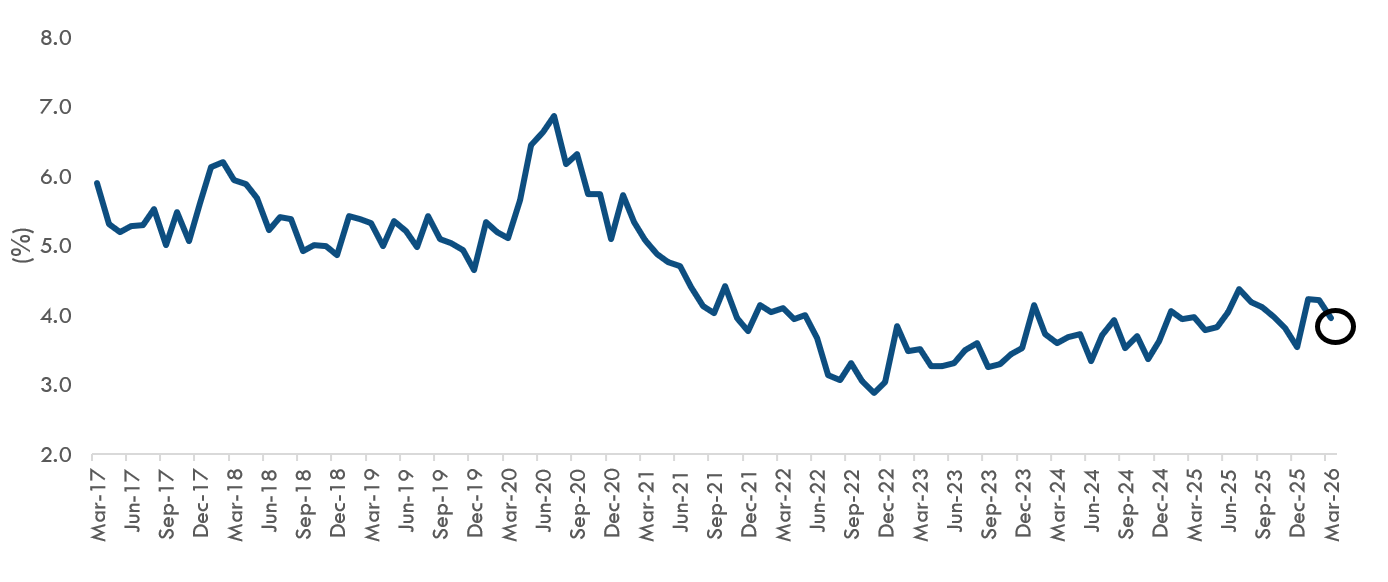
Regional Australia Unemployment Rate
The regional unemployment rate fell to 4.0% in March. Despite monthly variations, unemployment has generally remained at historically low levels, indicating a shortage of workers available to fill job vacancies.
Regional Australia Unemployment Rate
Source: ABS Labour Force (detailed) RAI