Glossary
Metrics
Internet Vacancy Index (IVI)
The IVI is a monthly data series that measures online job advertisements from major platforms such as SEEK, CareerOne, and Workforce Australia. Compiled by Jobs and Skills Australia (JSA), it captures newly lodged job ads during the reference month.
IVI Rate
The IVI Rate is a composite indicator that compares the IVI to employment. Derived from JSA’s IVI data and monthly NERO employment data, it helps understand the balance between job vacancies and the labour force, providing insights into sectors with potential labour shortages or surpluses.
It is calculated as 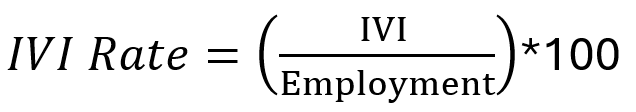
Participation Rate
The Participation Rate is the proportion of the labour force (those employed or actively seeking work) relative to the total working-age population. It is sourced from Labour Force, Australia, Detailed (ABS).
Regional Indicator of Stable Employment (RISE Index)
The RISE Index is a composite metric designed to assess the balance between job seekers and job vacancies in regional areas. It combines the Unemployment Rate and IVI Rate to highlight the mismatch between labour demand and supply. The RISE Index ranges from stable to unstable, with higher values indicating a well-matched and healthy job market, where both employers and the workforce are satisfied. Conversely, lower values reflect instability, where high unemployment coexists with unfilled job vacancies, signalling a labour market in distress.
It is calculated as 
Unemployment Rate
The Unemployment Rate reflects the percentage of the labour force that is unemployed and actively seeking work. It is calculated using smoothed Unemployed Persons and Labour force from the Small Area Labour Market (SALM) dataset provided by JSA. This metric helps identify regions facing higher unemployment pressures and highlights areas where job opportunities may be limited.
ANZSCO
ANZSCO
The Australian and New Zealand Standard Classification of Occupations (ANZSCO) is a skill-based system used to classify all occupations and jobs in the Australian and New Zealand labour markets. ANZSCO is structured into five hierarchical levels. The Regional Jobs Guide includes the top two levels of ANZSCO, Major Group and Sub-Major Groups. Only the IVI, IVI Rate, and RISE Index metrics can be filtered by ANZSCO.
Boundary Types
IVI Region
The IVI was historically reported against 37 custom boundaries across Australia, called IVI Regions.
Labour Market Region
Labour Market Regions is equivalent to SA4 2011 boundary type. It is used by data sourced from Labour Force, Australia, Detailed (ABS), such as Participation Rate.
LGA
The Local Government Area (LGA) is provided since it is the geographic boundary that most people would relate to. This boundary type is used by Unemployment Rate.
Caveats
Caveats
The data presented in this tool should be interpreted with caution due to the integration of multiple data sources.
- Vacancy Estimates: Internet vacancy numbers are estimates derived from Jobs and Skills Australia. For further details, please refer to the official caveats provided by Jobs and Skills Australia: Jobs and Skills Atlas Caveats.
- Boundary Translations: The five key metrics are provided across three geographic boundaries—IVI Region, Labour Market Region, and LGA—using a best-fit methodology to translate results from the original boundaries used in the collection of the data to other boundaries (see FAQs for more details). The boundary translations are as follows:
- The Internet Vacancy Index (IVI) is translated from IVI Region to LGA and Labour Market Region.
- The Participation Rate is translated from Labour Market Region to LGA and IVI Region.
- The Unemployment Rate is translated from LGA to IVI Region and Labour Market Region.
- Estimated Data: The translated data for these boundary types is estimated and should be used with caution. Users are advised to consider these limitations when interpreting the insights provided by this tool.
For further clarification on methodology and data considerations, please refer to our FAQs.
FAQs
How do I use the Regional Jobs Guide?
You can access three different pages: Map, Location Details, and Table, using the left menu. Each page offers unique insights into job market patterns.
- Map Page: Use the Map page to select boundary types, apply filters, and explore ANZSCO metrics. The map uses a choropleth colour scale, with darker shades indicating higher values. Use the bar chart to view metrics in descending or ascending order and right-click to drill into specific locations.
- Location Details: Select boundary types and locations to view bullet charts comparing your chosen area to a national or state baseline. Choose an ANZSCO metric for additional filtering.
- Table Page: The Table page presents data in a tabular format, sorted by location by default. Click column headings to adjust sorting and hover for location details.
How have metrics been converted from their original boundary type to another boundary type?
Metrics in the Regional Jobs Guide are typically reported by specific regions, such as IVI Regions for the Internet Vacancy Index. To make these metrics useful across other geographic boundaries, like LGAs or Labour Market Regions, we employ a method called ‘best fit’ correspondence. This process involves breaking down data into Statistical Area Level 1 (SA1) units, small areas that each cover around 200-800 people. By using SA1s as the foundational units, we can allocate data more accurately across larger regions.
The process starts by assigning each SA1 to its original boundary based on geographic overlap—assigning an SA1 to the region where most of its area lies. We then convert data from the original boundary to the target boundary by proportionally distributing metrics, like job vacancies, according to each area’s population, based on the 2021 ABS Census. For rates such as Unemployment Rate or IVI Rate, both numerator (e.g., unemployed population) and denominator (e.g., total labor force) are first translated separately, allowing us to calculate accurate rates within the new boundary.
Have any locations been excluded from this analysis?
Some locations, primarily within ‘Other Territories,’ are excluded from certain boundary types or metrics due to limitations in original data sources or boundary translations. Key exclusions include:
- Aurukun: No unemployment data available
- Christmas Island and Cocos (Keeling) Islands: Included in Pilbara (IVI Region) and ‘Other Territories’ for Labour Market Region and LGA; IVI data only
- Jervis Bay: Included in Illawarra (IVI Region) and ‘Other Territories’ for Labour Market Region and LGA; IVI data only
- Lord Howe Island: Included in Sydney (IVI Region), Mid North Coast (Labour Market Region), and ‘Unincorporated NSW’ for LGA; IVI data only
- Norfolk Island: Excluded from IVI and Labour Market Regions; included in ‘Unincorporated Other’ for LGA; no data available
When was the data last updated?
A data update process is run weekly, and all data sources are checked. If one of the data sources has been updated, then that new data will be ingested into the Regional Jobs Guide. The date all data was last checked (and updated if new) is shown in the bottom left corner of the Map page.
Why are some Greater Capital Cities missing when looking at IVI Region?
IVI Regions are quite large. In South Australia and Tasmania, the Greater Capital City area (relating to Adelaide and Hobart) makes up less than half of the IVI region that it’s in. As a result, that IVI Region has been classified as ‘Rest of State’, rather than ‘Greater Capital City’.
Disclaimer and copyright
This tool is intended to assist people to think about their perspectives, assumptions and understanding of regional issues. No responsibility is accepted by RAI Limited, its Board, or its funders for the accuracy of the information provided or for the quality of advice or decisions made by others based on the information presented. Unless otherwise specified, the contents of this tool remain the property of the Regional Australia Institute. Reproduction for non-commercial purposes with attribution of authorship is permitted.